Data Visualizations in chord chart of Vega
Link of works
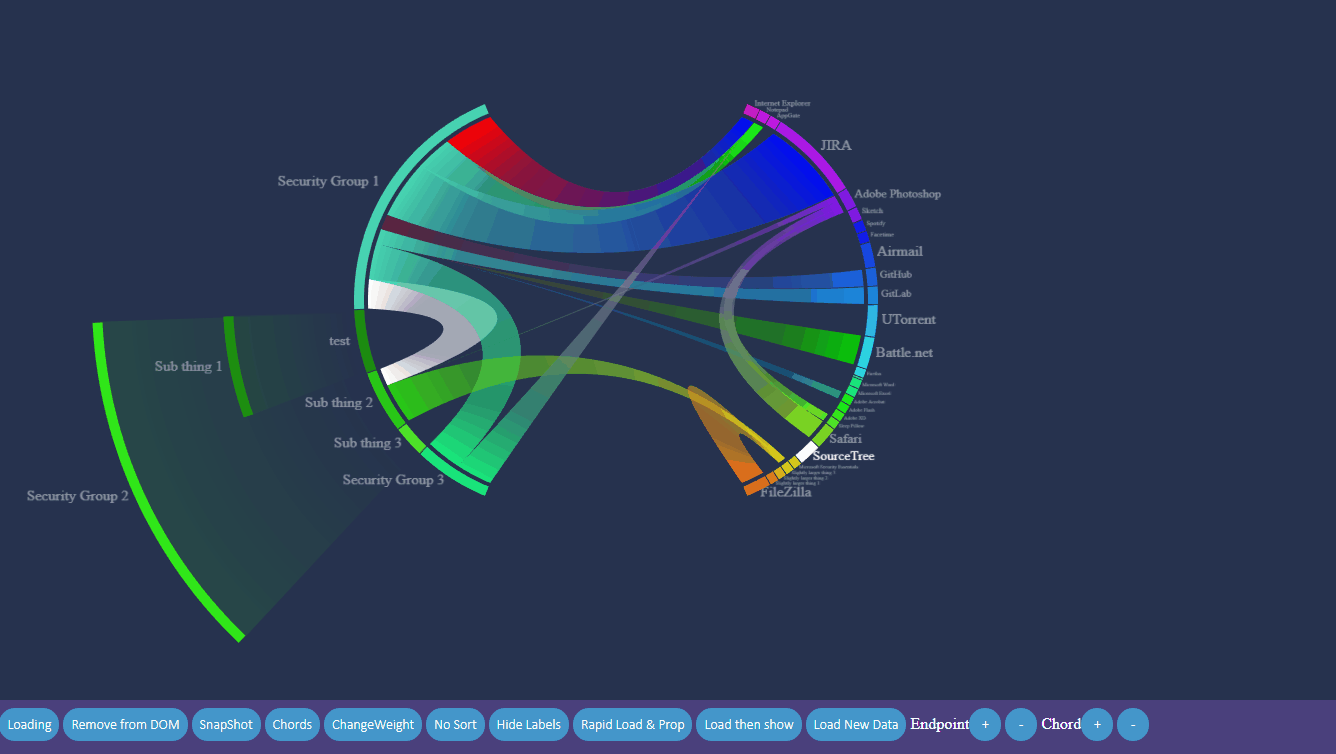
Chord chart was a project for my client, it mainly shows the nodes and ribbons which are used to connect nodes, and ribbons on hovering shows the data flow animation with directions on it. Nodes can be expanded.
- Loading and data flowing


- Expanding


Comments
Post a Comment